The true measure of success in marketing isn’t a spike in transactions. It’s a spike in transactions you can prove wouldn’t have happened without your campaign.
Because there are a whole host of factors that could’ve contributed to increased sales.
Maybe a competitor ran out of stock of the coolest new shoe and their customers had to shop elsewhere. Maybe grocery shoppers stocked up ahead of a holiday. Or maybe something just blew up on TikTok, completely unrelated to your campaign, and your brand happened to be in the right place at the right time.
But if you're using a sales spike as your yardstick, it's easy to think, "If I rinse and repeat that campaign, or run something similar, I'm going to get the same great results." And that's not necessarily the case.
Incrementality testing is really the only way to tell if your campaign worked. And according to eMarketer, 71% of advertisers now rank it as the single most important KPI in retail and commerce media measurement.
This guide covers how it works, how to run it, and how real merchants are using it to prove marketing spend actually works.
What Is Incrementality Testing?
Incrementality testing is a controlled experiment that answers one question: did this marketing activity cause a change in customer behavior, or would that behavior have happened regardless?
You find out by splitting your audience into two groups.
- The test group sees your campaign, whether that's an ad, a cash back offer, or a push notification.
- The control group sees nothing.
That gap between the two groups is your incremental lift, what you can credit to the campaign.
Attribution vs. Incrementality
Most marketers think they've already solved this with attribution. Spoiler: they haven’t.
A member of Bain's Advisor Network put it well:
“There’s a fundamental difference between marketing attribution and incrementality. To me, being able to measure something is attribution. Understanding how it changes consumer behavior is incrementality. Often those terms are used interchangeably, but they're really, really different.”
Last-click attribution hands all the credit to the final touchpoint before a purchase, even if that touchpoint didn't do anything. Multi-touch attribution models spread credit around using assumptions, not evidence. Marketing mix models find correlations, not causes.
And most importantly, none of these measurement methods can prove your campaign caused a sale.
They can only describe what happened alongside it. That distinction matters more now than it used to, since cookie deprecation and walled gardens have made platform-reported attribution even less reliable than it was five years ago.
More on attribution vs. incrementality here.
Incrementality vs. A/B Testing
People also confuse incrementality with A/B testing.
An A/B test compares two versions of a campaign that’s already running. Everyone sees a version of your campaign, you're just figuring out which subject line or creative performs better.
Incrementality testing asks a harder question: does any of this work at all?
A/B testing tells you how to make your marketing better, the other tells you whether it works.
Incrementality Testing Methodologies: Which One to Use
Not every incrementality test looks the same. The right methodology depends on your channel, your scale, and what you're trying to learn.
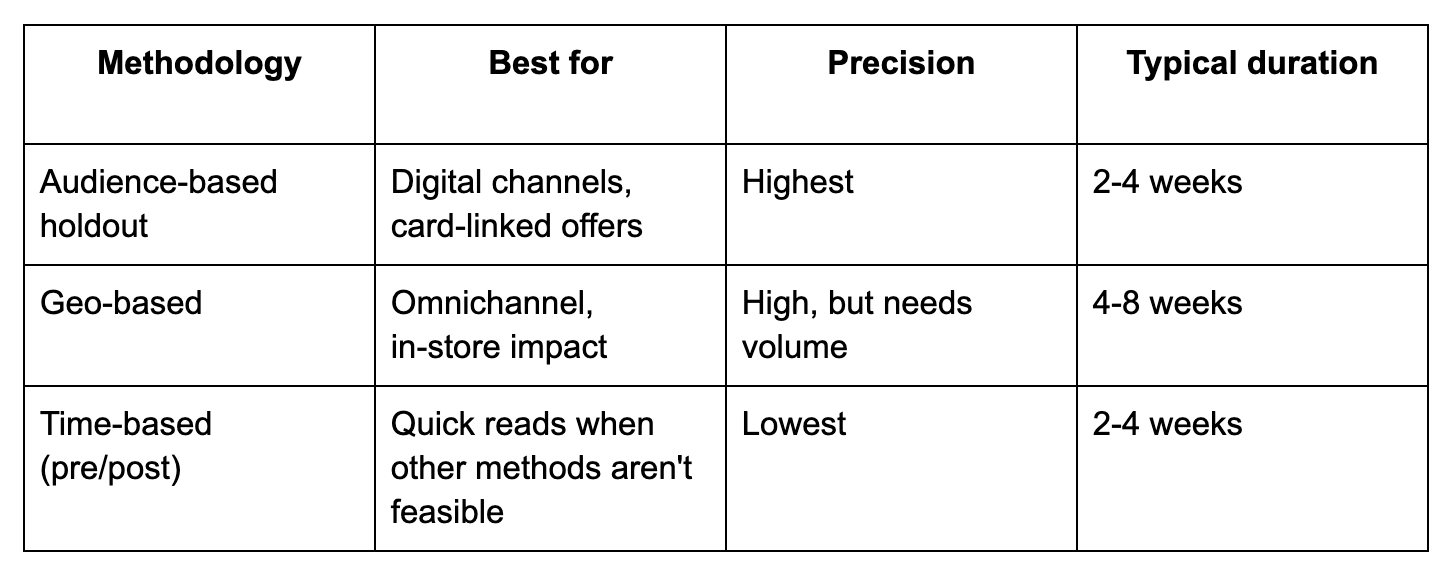
Audience-Based Holdout Tests
Audience-based holdout tests are the gold standard.
You randomly split your audience into test and control segments, usually 80/20 or 80/10/10, and only expose the test group to your campaign. This works especially well for card-linked offer platforms where you can control exposure precisely.
For example, say a QSR brand wants to know if a cash back promotion drives new visits or just rewards people who were coming in anyway. They run a 10% cash back offer through a rewards platform, but withhold it from 20% of eligible users as a control group.
Two weeks later, if the test group shows a 12% higher visit rate and 8% higher AOV — we can say with confidence that the cash back offer encouraged spending.
More on how we run incrementality testing here.
Geo-Based Tests
Geo-based tests compare matched geographic regions instead of individual customers. You pick a set of test markets where your campaign runs, and a set of control markets, matched as closely as possible on population size, past sales performance, and demographics, where it doesn't.
After the campaign runs for a set period, you compare sales performance between the two groups.
This is usually the right call when you can't cleanly isolate exposure at the individual level, which is common for omnichannel retailers running a mix of in-store signage, local media, and digital.
You can't build a control group by holding a physical in-store display back from half your customers. But you can hold an entire market back from the campaign.
The tradeoffs are precision (matching markets is harder than it sounds) and time (since you’re working with aggregate market data).
Time-Based Tests
Time-based tests turn a campaign on, then off, then compare performance between the two windows. Run your promotion for three weeks, pause it for three weeks, and see what changes.
It's the simplest method to run, but it’s also the noisiest — seasonality, competitor moves, and market shifts can all masquerade as campaign impact.
How to Calculate Incrementality
Incremental Lift
Incremental lift is the percentage increase in conversions, sales, or visits that your test group generated over your control group. It's the clearest signal of whether your campaign changed behavior at all.
Formula: ((Test Group Conversion Rate − Control Group Conversion Rate) / Control Group Conversion Rate) x 100
So, say your test group has a 15% conversion rate and your control group has 10%.
That would be:
(15% − 10%) / 10% = 50% incremental lift.
That’s a substantial lift, but it still doesn’t tell you whether the campaign was worth the money. For that, you need the next two metrics.
Incremental ROAS (iROAS)
Incremental ROAS tells you how much revenue your campaign generated for every dollar spent, counting only the revenue that wouldn't have shown up without it.
Incremental revenue is the revenue from your test group minus the revenue your control group would have generated, scaled for group size.
Formula: Incremental Revenue / Campaign Cost
So, say:
- Your test group generated $500K
- Your control group generated $350K
- The campaign cost $20K
iROAS = (($500K − $350K) / $20K) x 100 = 7.5:1. In plain English, that means every dollar spent produced $7.50 in revenue that wouldn't have existed otherwise.
Incremental CPA (iCPA)
Incremental CPA is what it cost you to acquire each conversion your campaign caused.
Formula: Campaign Cost / Incremental Conversions
Incremental conversions come from the same test-vs-control comparison as the other two metrics: take your test group's conversions, subtract what your control group converted at (scaled to match group size), and what's left is the number your campaign is responsible for.
So, say a $20K campaign drove 4,000 total conversions in the test group, but the control group's conversion rate, scaled up to the same audience size, would have produced 3,000 of those anyway.
That leaves 1,000 incremental conversions: $20K / 1,000 = $20 iCPA.
Here's why all three matter together.
A campaign showing 50% incremental lift sounds like a win. But if that lift only generated $15K in revenue against a $20K campaign cost, your iROAS is 0.75:1.
And if that $20K only bought you 500 incremental conversions instead of the 1,000 you expected, your iCPA just doubled to $40. Lift alone would've told you the campaign worked, but iROAS and iCPA tell you it lost money.
Incrementality Testing in Commerce Media (a Higher Bar)
Commerce media promises a closed loop between ad and transaction. That’s huge when you consider that other digital ad strategies are about selling impressions (not verified performance).
And it’s why CMOs and CFOs are being pickier about their commerce media spend.
If you can’t prove your campaigns are influencing real transactions, you’re probably not going to get more budget to run those campaigns in the future.
Incrementality is how you show it’s worth placing more similar bets.
Retail Example
A global electronics brand ran a Q4 campaign through a card-linked offers platform, offering new customers 7% cash back on online purchases. Against a control group that saw no offer:
- 19 million impressions, 70% Gen Z and Millennial shoppers
- Average order value up 166%
- Average spend up 43%
- 7.5:1 incremental ROAS, during one of the most competitive shopping windows of the year
Read the full case study.
QSR Example
Cicis ran a year-long, always-on cash back campaign inside banking apps popular with younger consumers. Because the campaign had a real control group built in, every number below reflects incremental impact, not just correlation:
- $2.7 million in attributed sales
- 2,500 weekly redemptions
- 72% of redemptions from first-time diners
- 11:1 topline ROAS
The remaining 28% of redemptions came from existing and lapsed customers, so this wasn't just new-customer math.
Read the full case study.
5 Best Practices for Running a Reliable Incrementality Test
1. Start With Clear Objectives
Decide what you're measuring before you design anything, because the objective determines the methodology, not the other way around.
- If you're measuring sales lift, your control group just needs to be a clean, randomly withheld slice of the same audience. Compare total sales between test and control over two to four weeks, and the gap is your incremental lift.
- If you're measuring new customer acquisition, incrementality gets trickier, because you have to prove the campaign brought in people who wouldn't have bought from you anyway. That means your control group needs the same mix of new-to-brand versus repeat customers as your test group going in, and you need enough purchase history on both sides to confirm someone is truly new. Skip that step, and your "new customers" in the test group might just be repeat buyers your control group happened to undercount.
- If you're measuring visit frequency, incrementality means comparing how often the test group came back against how often the control group came back, over the same window, typically 30, 60, or 90 days. A test that only runs two weeks will catch the first visit and miss whether the campaign changed the habit.
2. Choose the Right Methodology
The Interactive Advertising Bureau (IAB) and IAB Europe jointly released guidelines identifying four approaches to incrementality in commerce media last year:
- Experiment-based. The test-and-control methods covered above: audience holdouts, geo tests, and time-based tests. You directly measure the difference between an exposed group and an unexposed group.
- Model-based counterfactual. Instead of a live control group, you build a statistical model that predicts what would have happened without the campaign, then compare actual results against that prediction. Useful when you can't cleanly hold anyone back.
- Econometric. This is marketing mix modeling territory. You use historical data and statistical regression to estimate how much each channel contributes to sales, alongside factors like pricing, seasonality, and competitor activity.
- Hybrid proxy. A blend that uses proxy signals (like search volume or web traffic) alongside partial experimental data when a full holdout isn't feasible, often for upper-funnel or brand campaigns that don't have a clean conversion event to measure.
Audience-based holdouts tend to be most precise for digital and cash back channels. Geo-based tests suit omnichannel campaigns that end in a physical store.
3. Design for Statistical Power
Before you launch, run a sample size calculation using three inputs: your baseline conversion rate, the minimum lift you'd actually consider meaningful (usually 5-10%), and your target confidence level.
Most free sample size calculators will turn those three numbers into a required sample size per group.
95% confidence means there's less than a 5% chance your result happened by random luck rather than because of your campaign. In practice, that means running the test long enough and with a large enough audience to hit that threshold before you touch the results. If you stop early because the numbers look good, you're not testing anymore.
Run tests for at least two to four weeks to capture a full purchase cycle, and keep your control group at 10 to 20% of the total audience.
4. Watch for Pitfalls
Examples include:
- Underpowered samples. A 500-person test with a 10/90 split leaves you with a control group of 50. That's too small to conclude anything.
- Mismatched control groups. If your test group skews toward high-frequency urban buyers and your control skews rural and infrequent, you're measuring audience differences, not campaign impact.
- Insufficient duration. A one-week test captures a snapshot, not a pattern.
- Cross-channel contamination. If you withhold a push notification from your control group but they see the same offer on Instagram, your control isn't a control anymore.
5. Use Results to Plan Your Next Campaigns (and Corresponding Budget)
Rank channels by incremental value, not attributed value, and translate results into language finance already speaks: cost per incremental acquisition, payback period.
Some reward demand platforms, including Kard, build test and control group logic directly into cash back campaign infrastructure. That means the experimental design isn't a separate project you have to run on top of the campaign. It's built into how the offer gets served in the first place.
Start Proving Your Marketing Works
Platform dashboards will always tell you your campaigns are working. That's what they're built to do. Incrementality testing is the only method that tells you the truth — even when the truth is that a campaign you loved didn't move the needle at all.
A little short-term discomfort for a marketing budget you can defend, scale with confidence, and stop guessing about.
Want to see how incrementality testing gets built into a cash back campaign from day one? See how it works →
Incrementality Testing FAQ
Which Incrementality Testing Methodology Should Retail and QSR Brands Use?
Audience-based holdout tests. They work natively within digital and reward demand channels and produce clean, fast results. If you have a heavy in-store component that can't be controlled at the individual level, geo-based testing is the better fit.
Does Incrementality Testing Replace Attribution or MMM?
No. It completes them. Attribution shows what's happening across touchpoints, MMM gives you a macro view of channel efficiency, and incrementality testing confirms what's actually real. Plan with MMM, optimize with attribution, validate with incrementality.
Can You Do Incrementality Testing for Cash Back Rewards?
Yes, and it's built into how a platform like Kard runs a campaign.
When a brand launches a cash back offer, Kard randomly holds out a portion of the eligible audience from ever seeing that offer, then tracks purchase behavior across both groups using the same first-party transaction data.
Because the split happens before the campaign goes live, the comparison is clean from day one. Brands get incremental lift, iROAS, and iCPA as standard reporting.